Bitcoin’s Triangular Formation Signals a Potential 17% Surge to $68K**

The hourly chart of Bitcoin reveals a triangular pattern suggesting a potential bullish breakout. Could this signal a 17% surge, pushing Bitcoin to the $68,000 mark? Recent days have shown Bitcoin’s volatility confined to a sideways movement, but this period seems to be nearing its end. With fundamental demand on the rise, the indicators and derivatives market anticipate an imminent bullish explosion.
Shifting Dynamics on Bitcoin’s Hourly Chart
In the hourly timeframe, Bitcoin shows signs of consolidation after climbing to $61,000. This sideways trend has formed converging trend lines, creating a triangular pattern. Bitcoin currently finds support at this trend line, despite a recent sequence of four bearish candles causing a 1.30% price drop. However, in the last hour, Bitcoin rebounded by 0.20%, now trading at $58,812.
With Bitcoin holding its ground at the trendline, the likelihood of a bullish reversal is increasing. The Fibonacci retracement levels, set during the recent rally from $49,700 to the peak of $57,470, provide Bitcoin with 50% support at $58,676.
Moreover, the hourly RSI line shows sideways movement slightly below the halfway mark. Bollinger Bands on the hourly chart are also converging, indicating rising tension. This convergence boosts the chances of a sharp Bitcoin price movement.
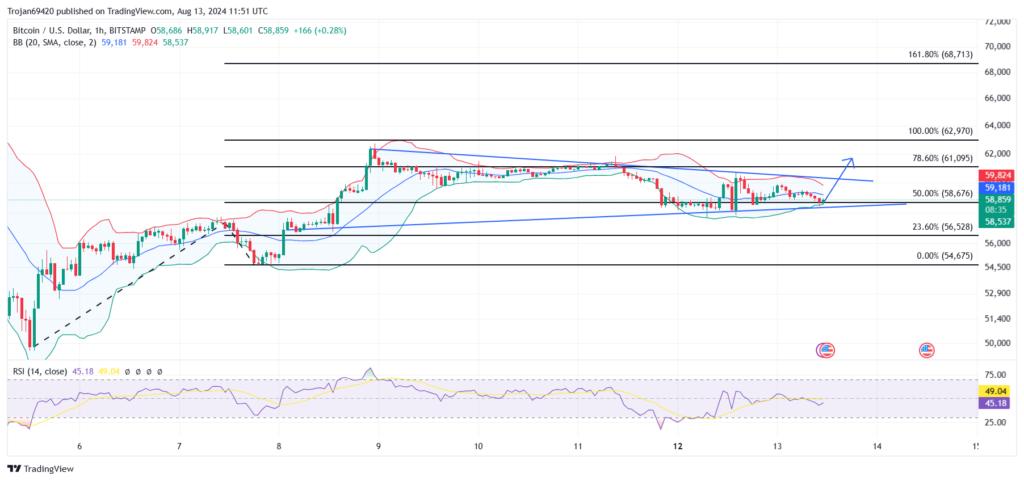
Given that consolidation initiated near the support trend line, a bullish divergence in the RSI has emerged, raising the potential for the uptrend to continue and breach the upper trend line.
Could Bitcoin Break the $63K Resistance?
A bullish breakout above the upper trend line would challenge the 78.60% Fibonacci level at $61,095, helping Bitcoin reclaim the psychological $60,000 level. With added momentum, Bitcoin is poised to continue its ascent, targeting the peak of $62,970, corresponding to the 100% Fibonacci level.
Post-breakout, a minor correction for a retest is plausible. This retest might find support at either the 78.60% Fibonacci level at $61,095 or the breached trend line near the $60,000 mark.
The subsequent rally post-retest could provide an ideal buying opportunity for margin traders. The uptrend is expected to surpass $63,000, paving a clear path to $68,713, the 161.80% Fibonacci level.
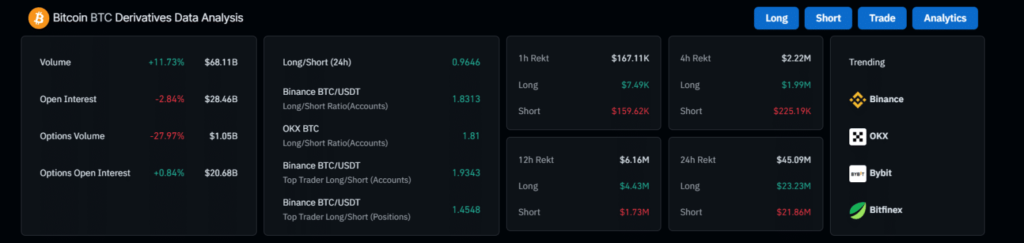
Derivatives Market Shifts Bullish
Read more Revived Bitcoin Wallets Spark Interest as Crypto Market Shows Signs of Recovery"
Over the past hour, short positions worth $159.62K were liquidated, contrasting with long position liquidations worth just $7.49K in Bitcoin. This liquidation data underscores a stronger bullish sentiment. Consequently, the shifting dynamics in the derivatives market bolster the probability of a bullish breakout in Bitcoin.
Important Notice: The content of this article is for informational purposes only and should not be construed as financial advice. chinwa.tech
assumes no responsibility for any investment decisions made based on the information provided herein. It is strongly advisç zed to seek the guidance of a qualified specialist or financial advisor before making any investment choices.